How to Understand Pinterest Analytics
Pinterest analytics – what the chuff are they? Pinterest is a super helpful little app and has a handy free tool for business account holders called Pinterest Analytics. In here there are all sorts of little snippets you can see to find out how well your Pinterest account is working, what content is resonating with your followers (and what content you should make more of) and what’s not doing so well so you can tweak your Pinterest marketing strategy accordingly. Pinterest analytics can seem overwhelming at first, so if you want to know what are the important Pinterest metrics to track and what are just vanity metrics (monthly impressions, I’m looking at you!) then read on.
How do you access Pinterest Analytics?
It’s simple to access your Pinterest Analytics. On desktop, you head up to the menu along the top of the screen and click on Analytics. A dropdown menu will appear where you can select Overview.
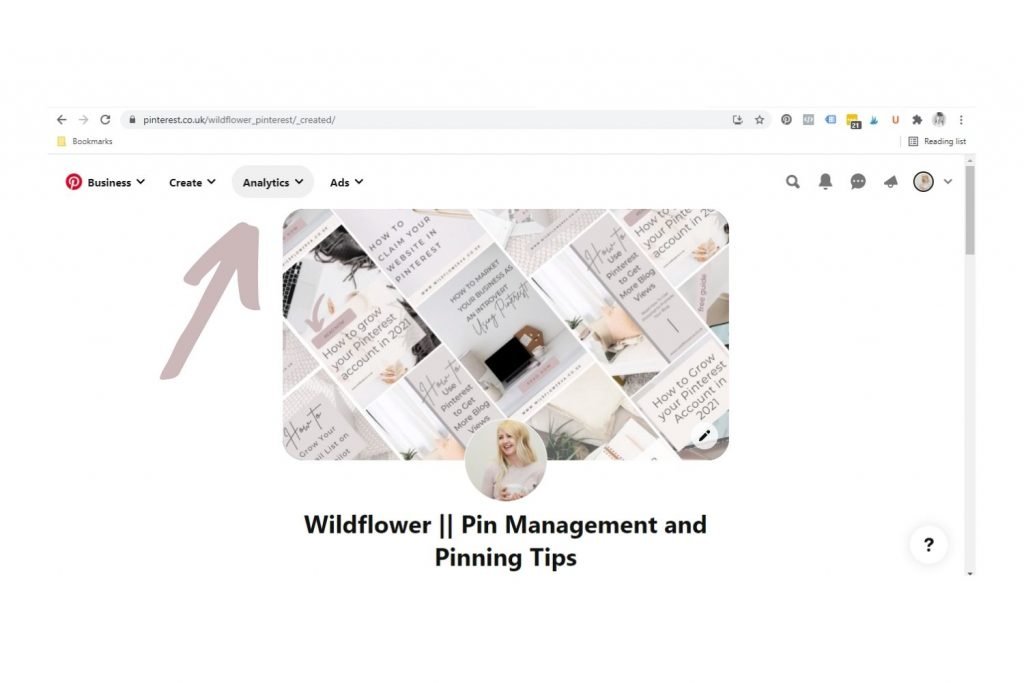
On mobile, it’s slightly different. On your account page, click on the graph icon and this will display your Pinterest analytics.


I would say you get more detailed stats on desktop than mobile, so I always tend to use desktop (especially for client reporting).
How to see Pinterest analytics
In your Pinterest analytics overview, you can see a whole variety of things from how many views your account has had, how many pin clicks or link clicks your pins have received and what format of pin is performing best for your account. You can see this information for a specific date range by selecting the dates on the left hand side.
Pinterest Analytics Explained
Underneath the date range selection box is Content Type, which relates to whether the content pinned by you or other people pinning your work was paid or organic. Unless you’ve been promoting ads your content will be organic.
Under Claimed Account you can select what content to view the stats for. Here you will have all your claimed accounts, such as your website, Instagram, YouTube channel or Etsy shop. In this context Other pins relates to pins that you have created but don’t relate to any of your claimed accounts, such as a podcast or landing page outside of your website domain.
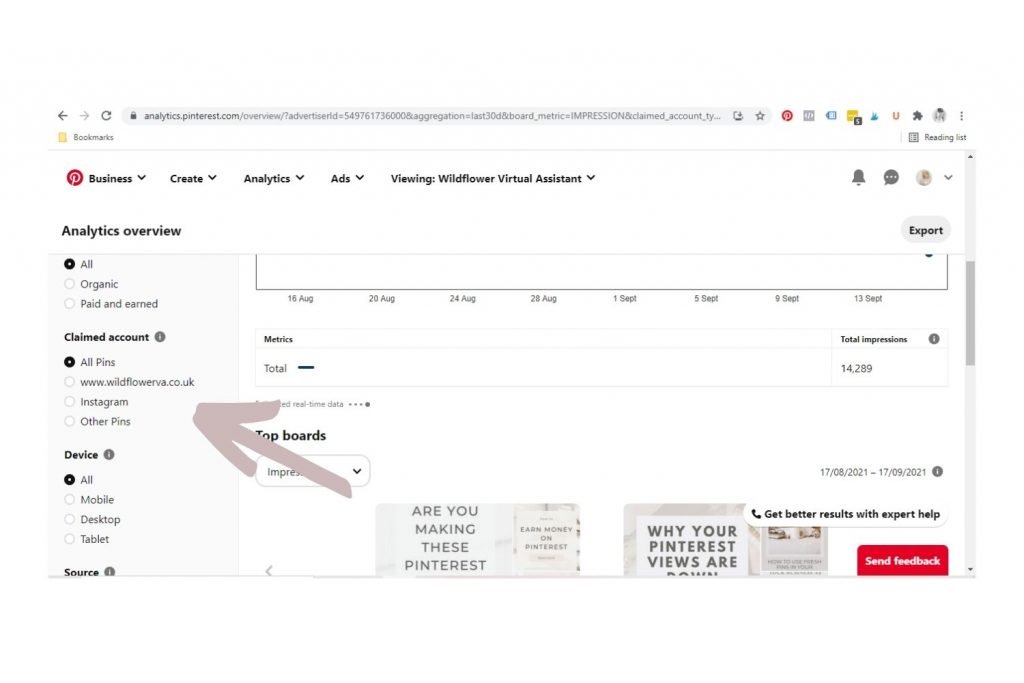
You can select the device the pins were viewed on if you need to compare the two, or wish to check out those pins only viewed on mobile.
Source relates to whether the pins were created and saved by you or those created and saved by other people from your claimed accounts, or both. This is good to see how well content is being pinned from your blog, for example.
You can select the Format of the pin. There are four types of pin (five if you include a carousel pin but these aren’t as popular) which are standard, video, idea or product. You can choose to view one of these or all of them to see how well they perform.
The last option at the bottom is Data. The default is to only view pins that you have saved from your claimed accounts, however you can include the pins that you have saved from other Pinterest accounts if you wish. Before 21 January 2021 this data included other pins but this has since changed.

Across the top of the page is an overview of your account. Here you can see your:
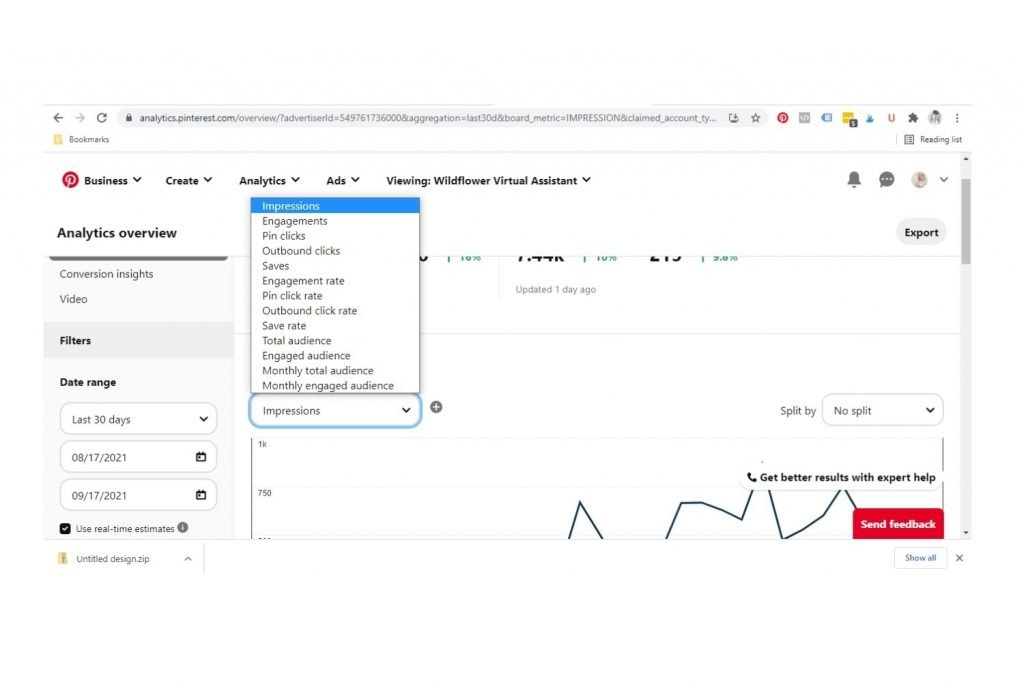
Impressions: The number of times your pins were on the screen. This is how many times they came up in a Pinterest users’ feed. I wouldn’t worry too much about this. While a large number of impressions is always good to see as it means your pins are being distributed by Pinterest, pinners may not even see your pin in the stream of pins as they scroll on their screen. A high number of impressions might look impressive, but doesn’t always translate to page views on your blog. I know of accounts with over 1 million monthly impressions but they get barely any clicks to their site!
Engagements: The number of times your pins were clicked on or saved. This is a good metric to focus on as it means your pins are attracting the right people. This is a metric you want to be increasing month on month to compare. You can check how this is split between Close Ups, Saves and Pin Clicks and record these numbers to see how your account is growing.
Total Audience: This is the total number of people who have seen and engaged with your pins within the time period.
Engaged Audience: The number of people who have engaged with your pins by either saving or clicking on them.
Just above the graph showing your Impressions is a drop down box where you can choose your metrics to see. You can overlay two metrics at a time to compare, for example Impressions and Pin Clicks, or Engagements and Saves to see how they differ.
You can also see your top performing pins and boards, which will give you an insight into what is resonating with your audience.
You can keep a track of your numbers in a simple spreadsheet. I like to use Airtable for my metric reporting.
Common questions about Pinterest Analytics
How to access Pinterest analytics?
You can access Pinterest analytics via the menu on the top of your Pinterest screen on desk top. FOr mobile, simply tap the tiny graph icon.
Is Pinterest Analytics free?
Yes, Pinterest Analytics is free. This amazing free tool will help you tweak your Pinterest strategy and get that all important traffic back to your site.
What are the most important metrics to focus on?
Different users will have different goals for Pinterest, and therefore be focusing on different metrics within Pinterest Analytics.
If you are a blogger you may be focusing on the long term gains from creating pins to link your blog posts to Pinterest, so impressions aren’t your main focus but pin clicks are more important. If you are wanting to build brand awareness you may find that creating Idea Pins that lead to higher monthly impressions and in app engagement are what you want to concentrate on. The point is to focus on the metrics that are important to you.
If your numbers are green, that’s a good sign! If they’re red and showing a decline, don’t panic. It could be a combination of factors including seasonality, one of the many peaks and troughs of the Pinterest year or a glitch such as the one a lot of bloggers suffered in early July 2021. They usually right themselves after a month or two.
If there is a huge decline in numbers and you can’t find an explanation such a seasonality for it, maybe reassess your strategy. Are you pinning fresh pins? Are you using spammy behaviour eg hashtags? Remember it can take 3-6 months for a new strategy to start to come good, and patience and consistency is key. Pinterest is a very long term game! If you need more information, this blog post on what to do if your Pinterest numbers are down might help.
Do you check your Pinterest analytics often?
I would recommend checking these every couple of weeks or at the very least monthly. I check my Pinterest management client accounts every week to keep on top of things, but if you manage your own account you might be more relaxed about it. Things change so slowly on Pinterest that checking every day isn’t necessary.
So the key takeaway from this is to get familiar with Pinterest analytics and decide which metrics are important to you and align with your goals. Focus on these, don’t worry too much about the others, and create or tweak your Pinterest marketing strategy accordingly.
If you need some help with your Pinterest marketing or creating a Pinterest marketing strategy, get in touch.



Leave a Reply